Quite often, people use the well-known normal distribution to estimate the kind of results that you should expect when playing video poker. But, this estimate is off by quite a bit unless you are talking about a very large number of hands (around 4,000,000 should do). For a smaller number of hands, we need to be more careful. On this page, I will examine four popular video poker games with quite different characteritics. Note that variance is measured in units of bets squared.
| Game | Expected Value | Variance |
|---|---|---|
| 9/6 Jacks or Better | 99.544% | 19.51 |
| Pickem Poker | 99.9536% | 15.01 |
| Deuces Wild | 100.762% | 25.84 |
| 10/7 Double Bonus | 100.172% | 28.26 |
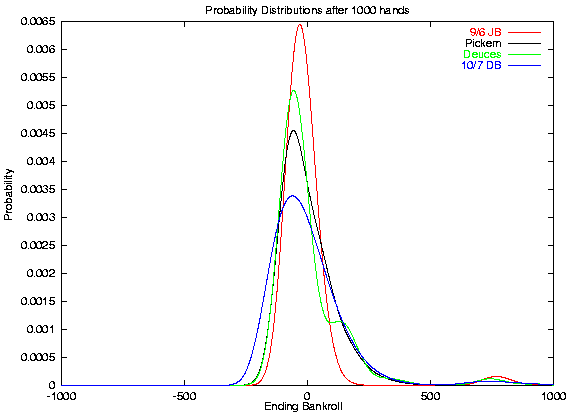
Video poker games tend to have high variance, and most of that variance is carried in the high payoff hands (typically Royal flush and special bonus hands such as Four Deuces). Although these hands have a major effect on the EV, for short term play, the probabilities of the common hands are more important. The following chart shows the probability distribution of ending bankrolls after playing 1000 hands of the four games specified.

Although the area under each curve is the same (they all integrate to give 1.0), they have different shapes. The Jacks or Better curve is sharpest because JB does not have a second high paying hand besides the Royal. On the other hand, Deuces Wild has a distinct "knee" at around 200 units, which corresponds to the 200 unit payout of the "mini-jacpot" of four deuces. Also notice the little "blips" at around 800 units on each curve. All of the games pay 800 for a Royal, and those blips represent the chance of getting a Royal in 1000 hands.
Looking at these curves alone, it is hard to see that Deuces Wild has the highest EV and Jacks or Better the worst. In fact, for such a short session, you are more likely to be near even, and to avoid a large loss, play JB rather than the other games, even though it has the worst EV. So, what happens if we look at a larger session?
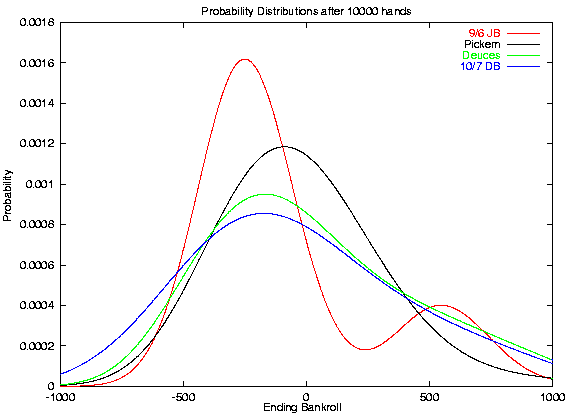
After 10,000 hands, things start to smooth out quite a bit. It is apparent that the lower EV of JB is starting to drag it downward -- the long term expectation is to lose your bankroll playing any negative expectation game. Also notice that the "four deuces" knee has been completely absorbed in the Deuces curve, and the Royal knee is starting to merge for Jacks (it will take about 30,000 more hands before the Jacks knee is no longer apparent). Also, Deuces is starting to look a good bit better than Double Bonus (especially on the left hand side, where the losses are!).

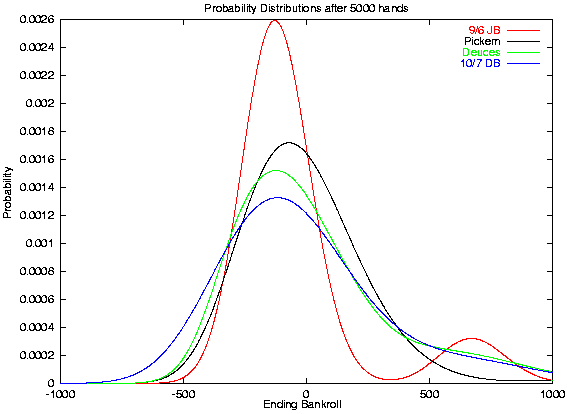
But, 10,000 hands may be a bit long for a session for most players. I picked 5,000 hands as a good intermediate value that is close to what I expect most players would plan for a short trip.
After 5000 hands, the left hand Jacks peak is almost perfectly normal --- but it matches a normal curve with a variance (and expecation) corresponding to subtracting out the Royal. Because cases where a Royal does occur (represented by the right hand peak) are well-separated from the first case, here we can get a good approximation of the distribution by combining two normal curves. But that is not true for Deuces or Double Bonus (Pickem is quite close to normal by this point because the very high paying hands are so rare). Notice that both Deuces and DB are not symmetric -- the right hand side of the curve has "lifted its foot" considerably.

So, what does this mean to the player? I'm glad you asked. We can redraw the same curves to give the cumulative probabilities and read off what to expect on a session of 5000 hands.

For any given ending bankroll (starting from zero, remember), the curves indicate the percentage of the time that you will end up at or below the indicated point after 5000 hands of the chosen game. Looking at the vertical line at zero ending bankroll, we can see that you should expect to lose at Jacks or Better about 72% of the time, but only about 55-56% of the time at the other games. From the other angle, the 50% horizontal line show that half the time we should lose 102 units or more when playing JB for 5000 hands, but only 32-51 (or more) for the other games.
From a trip bankroll perspective, the 5% and 10% lines may be the most interesting. For a 5000 hand session, Double bonus can be cruel -- you will end up losing over 400 units one trip in 10, and 488 or more 1 in 20. The other games aren't quite so bad, but you must be prepared for the variance.
Be careful of one thing --- the curves assume you play the full 5000 hands. So, you might dip below the ending bankroll on the way to getting there. You really need a bit more than the curves indicate (ballpark estimate: 10%) to be sure you don't end up with playing more before the end of your trip more frequently than you had planned for.
I hope these curves will help you to understand the cruel yet enticing game of video poker. We can't get rid of the variance, but we can understand and prepare for it.
--jazbo